Category Archives: Wealth & Philanthropy Intel

Wealth X Report: Billionaire Census

What is this Report?

In its seventh edition, the Wealth-X Billionaire Census looks at the billionaire class throughout the world. The report looks at both how billionaires fared in 2019 as well as how they are doing in 2020 with the coronavirus and economic setbacks.

What are key findings from the article?

  • In 2019, the number of billionaires grew by 8.5% (2,825 number of billionaire). Their wealth grew by 10.3% from 2013 ($9.4 trillion). Asia and US led with the largest percentage increase in billionaire: 12.0% in Asia and 11.2% in the US. The Pacific, Europe, and Africa had gains as well with 10.0%, 6.9% and 5.1% respectively. Latin America and the Caribbean and the Middle East saw decline of -1.4% and -1.1% respectively.
  • North America saw the largest gain in wealth with an increase of 13.8% to $3.5 trillion. Wealth gains are ascribed to the robust stock market, US Fed’s monetary policy easing and a US-China trade agreement. Asia’s wealth increased by 11% to $2.4 trillion with gains accredited to the stock market but influenced by depreciation against the US dollar, US-China trade dispute and more.
  • While billionaires constitute just 1% of the Ultra High Net Worth Population ($30M+ in net worth), their wealth holdings constitutes 26% of the group’s wealth. Since the report started, that percentage increased from 22% to 26%. The wealth distribution is skewered even further with billionaires who hold over $10 billion or more number 153 individuals (5.5% of the total number of billionaires) who hold 35% of the total billionaire net worth.
  • The US has the highest percentage of billionaires with 28% of the global billionaire population. The report notes: “Cumulative billionaire wealth in the US increased by 14% to $3.4trn, more than the combined net worth of the next eight highest-ranked countries and equivalent to a 36% share of global billionaire wealth.” 
  • New York is number one in top 15 billionaire cities. San Francisco is number 3 and Los Angeles is 7. The report notes: “Indeed, there are more billionaires in New York than in almost every country in the world, with the exception of China and Germany.”
  • With the onset of COVID-19, the number of billionaires in insurance, technology and healthcare increased 6% to 9% while apparel, shipping and aerospace declined in the first five months. Wealth-X calculated that billionaires in the technology sector saw increases in wealth by 18% and those in insurance saw 11% in growth. But not all billionaires fared well with the economic uncertainty and setbacks that came with COVID-19. Wealth-X believes that over half of billionaires saw a decline in number and their wealth.
  • Philanthropy is the top interest, passion and hobby for both billionaires and Ultra High Net Worth Individuals. Sports is second for both categories. Over half of billionaires are active in philanthropy. Women and people who inherited wealth are more likely to give than men and people who earned their wealth.
  • Education is the top philanthropic cause for billionaires, followed by social services and then healthcare and medical research.

What can I do as a result?

  • While COVID-19 has impacted everyone, even billionaires, there are opportunities for large gifts. Billionaires in the insurance, technology and healthcare industries have seen gains in their wealth.
  • For organizations looking for funds specific to coronavirus, they may want to look at younger self-made billionaires since billionaires who have already given to coronavirus have been younger side than other philanthropic billionaires. This group may also be less well-known given their age and recency of making their fortune since they tend to be self-made.
  • Since billionaires favor education, social services and healthcare/medical research right now, there may be opportunities for substantial gifts in those areas. As the world rushes to find a vaccine, there may be significant opportunities for gifts to fund vaccine and coronavirus research.
  • When reviewing prospects for your organization, it may be worth looking at New York City, San Francisco and Los Angeles. These are the three US cities with the greatest number of billionaires.
  • This may be a squeaky record but keep talking to your prospects. Some prospects want to give gifts to organizations but the only way to know is to talk to them.

Additional Resources

Global Wealth 2019: Reigniting Radical Growth by Boston Consulting Group

Another Report of Global Wealth Decline – What Can You Do Now?

What is this Report?

The Global Wealth report is an annual report about the global market sizing and global wealth-management industry. The market sizing review “encompasses 97 markets that collectively account for 98% of the world’s gross domestic product.” The analysis of the wealth-management industry is based on data from over 150 wealth managers.

The Boston Consulting Group (BCG) report uses the following wealth based segments: retail (less than $250K); affluent ($250K-$999K); lower High Net Worth (HNW) ($1M-$19.9M); Upper HNW ($20M-$99M); and Ultra HNW (more than $100M+).

What are key findings from the article?

  • Global wealth indicators suggest a slowdown in global wealth. “2018 was the worst year for stocks in a decade” per the report. Global personal financial wealth is slowing down; it only grew by 1.6% in 2018 compared to 7.5% in 2017
  • North America saw a -0.4% decline in 2018 while Western Europe saw a modest increase of +0.6%. Asia as a whole saw an increase of +7.1% in asset growth, compared to +11.5% in 2017.
  • Although stock was down, the report points out that the last five years showed a “substantial increase in global wealth overall.” Investable assets such as investment funds and equities grew and “now account for 59% ($122 trillion) of all personal financial assets.”
  • The number of millionaires are still growing to 22.1 million in 2018 with a rise of 2.1% per year. This group holds 50% of global personal financial wealth. The largest concentration is the North America. Between 2018 and 2023, BCG predicts Asia (excluding Japan) will see the fastest growth in millionaires with 10.1%.
  • UHNW individuals with net worth of $100M+ are expected to see their wealth grow the most with an 8.6% increase.
  • While many wonder about economic downturn, BCG’s analysis suggests that wealth will have a modest growth rate of 5.7% from 2018-2023 with the concentration in North America and Asia.
  • Finally, BCG believes that there is an underserved market in the affluent segment that wealth managers need to do a better job of attracting, serving, and keeping as customers.

What can I do as a result?

  • Recognize that there may be a global economic slowdown. In 2018, Capgemini also reported a 3% decline in world wealth; BCG reported a slower growth of 1.6%. There seems to be an impact on giving since Giving USA found that total giving declined by 1.7% in 2018.
  • Focus on the affluent wealth segment (net worth of $250K-$1M). In response to the recent Giving USA report, The Chronicle of Philanthropy recommends that nonprofits seek out the smaller-dollar donors. Clearly, fundraising and wealth management organizations have been underserving the affluent wealth segment, which has potential for both industries.
  • With increased wealth management guidance, the affluent segment may expect fundraisers to accommodate more complex gifts such as trusts, Donor Advised Funds, and more. Consider how you can improve your capacity for these gifts, whether it is a relationship with a consultant, support from your community foundation, or improved database procedures.
  • Gift officers and their institutions should continue to look to build their relationships with Asian constituents and figure out how to be more donor-centric to these populations, just as wealth managers need to be more customer-centric with affluent wealth segments. You might consider targeting continuing education dollars to the subject.

Additional Resources

World Wealth Report 2019 by Capgemini

Global Wealth Declined 3% – Are Major Gifts at Risk?

What is this Report?

The World Wealth Report is an annual report about the wealth of high net worth individuals (HNWI) and the economic conditions in the Wealth Management industry. This year’s report is the 23rd year based on responses from over 2,500 HNWIs in 19 wealth markets, administered between January and February 2019. It measures “HNWI investment behavior including HNWI trust and confidence, satisfaction, comfort level with fees, and personalized services.”

Capgemini defines HNWI as those who have “investable assets of US$1 million or more, excluding primary residence, collectibles, consumables and consumer durables.”

What are key findings?

  • Global High net worth wealth declined 3% in 2018, after seven years of growth. The most affected regions were Asia-Pacific and Europe. North America was mostly flat while the Middle East reported an increase in HNWI population and wealth.
  • 75% of the decline was attributed to Ultra High Net Worth Individuals, decreasing 4% by population and 6% by wealth.
  • Clients want to have an emotional connection with their wealth managers. 28% of HNWI surveyed said that “advisor’s lack of emotional intelligence as the reason they did not connect well.” They are looking for friendly personalities, good listeners, market expertise, risk management expertise and more.
  • In terms of asset allocations, cash became the largest asset class in Q1 2019 due to declining markets. Cash is 28% of HNWI financial wealth, knocking equities to number two. Real estate has been dropped to fourth place, from 16.8% globally in 2018 to 15.8% in Q1 2019. Fixed income is now number three.
  • Top four markets are still the same from 2017 – US, Japan, Germany and China.
  • The world economy seems uncertain due to rising interest rates, the trade war—notably between the US and China, as well as political uncertainty with Brexit and Venezuela, and general market volatility. Notably, CNN called 2018 the worst year for stocks in 10 years.

What can I do as a result?

  • If HNWIs want more emotional connection with their wealth managers, it follows that those traits are necessary for gift officers. In a 2019 article in the Chronicle of Philanthropy, Mark Stuart who was employed by San Diego Zoo Global at the time, advocated for the use of the DiSC personality profile to train gift officers on better connecting with donors and prospects. Being knowledgeable isn’t enough anymore, even when it comes to money. Upgrading your emotional intelligence skills is recommended.
  • While cash is now the largest asset category due to declining markets, HNWIs may be more circumspect about donating their dollars. They may be even more critical in how organizations are using their dollars and it may take more time to communicate the benefits of donating to your organization. However, since North America saw minimal change in total wealth, these concerns may not have taken hold – yet.
  • Real estate has gone down as a percentage of asset class. However, that means those $1M+ houses are now a smaller percentage of giving, which is great for prospect researchers when determining capacity.

Additional Resources

The Wealth Report 2019 by Knight Frank

“How private wealth is shaping property markets globally.”

What is this Report?

The Wealth Report | Knight Frank 2019

The Wealth report is an annual report that looks at how private wealth impacts property throughout the world. It focuses largely on real estate but also talks about luxury items like art, whiskey, and yachts. The report also looks at habits of Ultra High Net Worth (UHNW) individuals.

UHNW is defined as someone with net worth over US$30M. HNW is defined as someone with net worth over US$1 million. Both definitions exclude the primary residence.

What are key findings from the article?

  • Wealth continues to become more global. Ultra High Net Worth Individuals (UHNWIs) are purchasing additional homes in cities and countries. 36% of UHNWIs have a second passport and 26% of them are planning to emigrate permanently.
  • Whiskey has become a valuable collectable by HNWIs. Expert Sami Robertson sees single malts taking the place of wine in people’s hearts and pockets. A bottle of The Macallan 1926, with a hand painted bottle, went for £1.2 million in November in 2018.
  • Knight Frank reports that “Sales of Scotch whisky to India, China and Singapore rose by 44%, 35% and 24% respectively in the first half of 2018 according to the Scotch Whisky Association, with single malts totaling almost 30% of total exports.” Some HNWIs purchase their own casks, paying six- or seven figures. Quality Casks are not easily obtained as many distillers hold on to them. Some companies sell limited numbers to an elite few. The Macallan has an invite only program with costs starting at £35K.
  • While whiskey may be on the rise, the luxury housing market is slowing down across the world. Prices are growing slowly or declining. Notably, cities like Manhattan, London, and Vancouver are seeing a decline. This might reverse those markets to become buyer’s markets.
  • Part of the decline may be due to governments wanting to contain wealth and real estate in their countries. Governments are starting to implement new taxes to discourage foreign interests from purchasing real estate. In Vancouver, taxes are higher for non-residents, subject to an empty home tax, and other disincentives. Other countries, like China and India, are implementing capital controls to keep ownership in the country.

What can I do as a result?

How do I identify and connect with HNWIs?

  • Talk to them about their passions. What do they collect? Whiskey might be a new area of high-end collecting but HNWIs may collect other standbys, such as cars, wine, and art.
  • HNWIs are going to be even more mobile than before with additional passports and multiple properties, in spite of government attempts to contain the wealth. While it may be hard to research and find properties in other countries, guided conversation can reveal multi-country property ownership.
  • Pay attention to how your prospects’ talk about their future as well as the country or countries they live in. As wealth restrictions rise, their worldview about wealth and politics may impact their philanthropic giving.

Additional Resources

2017 BNP Paribas Individual Philanthropy Report

By Elizabeth Eck

“Unlike many older philanthropists, this globally connected and tech-savvy cohort is not content with just writing a charitable cheque. They see their skills, networks and for-profit investments as part of how they make an impact with philanthropy.”  -The Economist Intelligence Unit

2017-BNP-PARIBAS-PHILANTHROPY-REPORT_FINAL_Page_01What is this Report?

Based on interviews conducted between November 2016 and January 2017 with affluent millennials and experts, the report assesses the shift in the approach to philanthropy by the next generation of affluent families, focusing on millennials engaged in family foundations. The report explores the millennial mindset, their investment tools and strategies, and the balance struck between family legacy and philanthropic innovation. The report defines millennials as those born between 1980 and 2000.

What are key findings from the article?

  • Millennials are taking the reins. Though the bulk of wealth and charitable giving remains in the hands of older generations at this point, millennials are increasingly being given the reins of family businesses and foundations and becoming the decision-makers.
  • Millennials believe in social entrepreneurship and are thus willing to support or invest in social enterprises and for-profit organizations, sometimes setting up their own. The sectors in which they invest include FinTech, EdTech, food/agriculture, and energy, and they are looking for sustainability – such as job creation and lifting individuals out of poverty. Meanwhile, traditional beneficiaries such as arts institutions are of less interest.
  • Social media has inspired a global perspective. Social media, online news publications, and ease of travel have led millennials to take a more global, dispersed approach to philanthropy. And there’s a sense of urgency to their giving – they want to tackle problems now.
  • Millennials are digitally social. Unlike previous generations, millennials like to use social media to announce the family foundation’s initiatives and achievements and to draw attention to their work. They are also open to collaborative approaches, often using social media to identify strategic partners.
  • Impact investing is interesting. While family foundations often invest endowments in conventional instruments such as stocks and bonds, millennials are increasingly interested in innovative financing tools and impact investing. Impact investments are those made to organizations and funds with the intention of generating social and environmental impact alongside financial return.
  • Millennials are unlikely to abandon traditional grant-making altogether. The report also notes that traditional grant-making and charitable giving is not expected to end as not all issues can be addressed through market-based solutions. Human trafficking and domestic abuse are cited as two examples. Moreover, social entrepreneurs require seed funding in early development.
  • Millennials view legacy more in terms of actions than institutions. As for the balance between family legacy and philanthropic innovation, in general, millennials are less concerned with the formalities of passing a legacy onto the next generation than their elders; however, they are instilling an appreciation for philanthropy in their own children. Rather than family legacy, they think in terms of a legacy of giving where there is less constraint and more incentive to turn ideals into action.

What can I do as a result?

  • Millennials care about being heard and being involved in good causes. Ask millennials for feedback. Even if the older generation is still the decision maker in a family foundation, engage the younger generation as they will be inheriting the reins before long. Ask for their feedback in terms of where they see the foundation going and what issues are important to them. Ask for feedback on how your institution might make improvements. Ask the millennials to volunteer for your organization.
  • Millennials want to tackle causes they care about – now. Learn to utilize all forms of social media – Facebook, Twitter, Instagram, LinkedIn, etc. Establish your presence and contribute meaningful content that tells your story with a sense of urgency.
  • In social media, find and follow foundations tackling the issues in your field. Comment on their posts so they begin to become familiar with your name and organization.
  • Learn to use digital assessment tools to track your impact and then share that information. Again, you want to tell your story and your successes.
  • If you’re in a traditional non-profit organization that doesn’t fall within the realm of social or environmental work, don’t despair. Think in terms of what might appeal to a millennial. Many arts and educational institutions, for example, offer programs for underserved youth. Trumpet the work you’re doing with those populations. You may find the funders following you on social media.

Additional Resources


What’s New in the 2018 Capgemini World Wealth Report

By Elizabeth Eck

“North America accounts for 31.3% of global HNWI population and 28.2% of wealth. The HNWI population in North America grew by 9.9% in 2017 as compared to 7.8% the previous year, while HNWI financial wealth grew at 10.3% to reach US$19.8 trillion. -Anirban Bose

Capgemini WWR 2018What is this article?

The 2018 World Wealth Report gleans data from more than 2,600 surveys from around the world to report on trends for high net worth individuals (HNWI) and ultra-HNWIs.  The report provides insights into asset allocations and investment preferences, such as working with wealth managers and the growing interest in cryptocurrencies.

Capgemini defines HNWIs as those having investable assets of US$1 million or more, excluding primary residence, collectibles, consumables, and consumer durables.

What are key findings from the article?

  • Global HNWI wealth grew 10.6% to surpass the US$70 trillion mark and remains on course to reach US$100 trillion by 2025, with the Asia-Pacific region leading the way.
  • Asia-Pacific and North America fueled the 2017 growth in HNWI population and wealth, with Asia-Pacific accounting for 42.4% of the rise in HNWI wealth and North America accounting for 27.4%.
  • The US, Japan, Germany, and China are the four largest markets for HNWIs, with the US leading at 5.3 million in 2017, a 10% increase over 2016.  Guidestar estimates the number of active US nonprofits courting these individuals at more than 1.8 million, so there is great competition to secure funding from these individuals.
  • Though asset allocation remained fairly stable, real estate saw a significant increase in HNWI asset allocation in 2017, with an increase of 2.8 percent globally to 16.8%, becoming the third-largest asset class, behind equities and cash.
  • In North America, real estate represents 12.4% of HNWI assets, with residential real estate dominating the class at 52.3% – followed by 16.1% in commercial real estate (excluding hotels), 10.2% in land, 7.0% in farmland, and 5.6% in hotels.
  • HNWIs are becoming interested in investing in cryptocurrencies though the wealth management industry remains cautious because of regulatory uncertainty.
  • Wealth management firms are preparing for the entry of BigTech, which Capgemini defines as data-driven tech firms not traditionally present in financial services such as Amazon, Google/Alphabet, Alibaba, Apple, and Facebook.  Leading wealth management firms are investing in intelligent automation and artificial intelligence to prepare for the greater role that BigTech firms will play.

What can I do as a result?

  • Except in cases of public company insiders, the two biggest asset classes, equities and cash, are not readily transparent to a prospect researcher. Real estate, on the other hand, remains the most often used asset in determining gift capacity because of its transparency in the US. Capgemini estimates US real estate at 12.4% of a HNWI’s total assets, so this number can be very useful for estimating net worth.
  • The US leads the pack in the number of HNWIs – 5.3 million. For those prospecting in the US, there is a vast pool of wealth to tap into.  There is also great competition though, with 1.8 million active nonprofits vying for gifts from those individuals.
  • With the burgeoning interest of HNWIs in cryptocurrency and BigTech, there will be a need for prospect researchers and fundraisers to understand better how wealth management firms will be leveraging these vehicles.

Additional Resources

The Wealth Report | Frank Knight | 2018

“It is therefore a fairly safe bet that the next decade will not see a repeat of the double or even triple digit property price growth we have seen in leading markets over the past ten years.”


What is the Report?

The Wealth Report is a global perspective on prime property and investment published by Knight Frank, a global real estate consultancy firm. The report defines prime property as the most desirable and most expensive property in a given location, generally the top 5% of each market by value. The report emphasizes ultra-wealthy individuals, defined as US$50 million or more in net assets

What Are Key Findings From The Report?

2017 was a banner year for the real estate markets and for the ultra-wealthy. Where are those wealthy individuals and what do they look like?

  • Leading with the most ultra-wealthy individuals, North America takes the top spot with 44,000; Asia overtakes the second spot with 35,880; and Europe narrowly finds itself third with 35,180.
  • Recent changes in U.S. tax law favor a continued upswing in wealth accumulation. Interestingly, while New York tops the list of ultra-wealthy residents now and predicted into the future, London out-performs for where the ultra-wealthy invest in real estate and have preferred lifestyle elements such as quality universities and luxury hotels, shopping, and restaurants.
  • While the majority of the ultra-wealthy have their primary residences in the country from where their wealth is derived, a significant number are globally mobile.
  • Top three reasons for luxury investments: (1) joy of ownership, (2) capital appreciation, and (3) safe haven for capital.
  • Two key trends in 2017 for luxury residential markets were a big slowdown in China’s top-tier cities: Guangzhou, Beijing and Shanghai; and growth in Europe, including Amsterdam, Frankfurt, Paris and Madrid.
  • The top three priciest cities for luxury residential real estate, relative to square meters, were Monaco, Hong Kong, and New York.

What Can I Do As A Result?

  • If the ultra-wealthy are not in your database or on your radar, you still have some takeaways from this report: Owning a second home is a reliable indicator of someone who has wealth. For those that do own multiple properties, consider the top three reasons. Use conversation to help you identify whether the second home purchase is purely out of joy and stretches the purse strings, or if your prospects considers it a good investment, which suggests smart financial planning.
  • New York and London remain the global hotspots for the ultra-wealthy and in the U.S., real estate ownership and sales are public pieces of information. If you have US$1 million gift prospects, consider these addresses as key indicators of wealth worth verifying.
  • While Asia is vying with Europe for the most ultra-wealthy individuals, if your prospects are in China you will want to keep current with government decisions that impact wealth accumulation.

Additional Resources

Aspire Introduces Wealth Tiers and Asset Allocation Model

By Erica Sauer

Wealth Tiers and Asset Allocation Models Aid Research

This year in 2018, Aspire introduced its Tactical Briefings and Strategic Assessments. These profiles estimate net worth, assign a wealth tier, and project asset allocations.
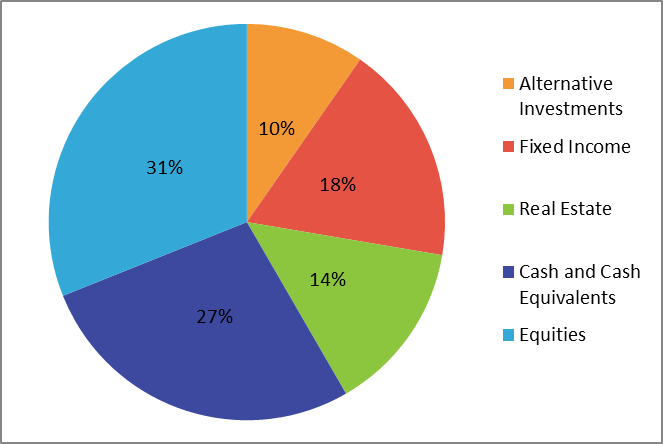
The thread tying everything together is estimated net worth. Net worth is defined as assets minus liabilities. Because liabilities such as debts are private and not all assets are public, we can only estimate net worth. Although estimated, it’s still a helpful tool because the visibility of public assets tends to diminish with wealth.

Wealth Tiers

Wealth Tier Net Worth Low Net Worth High
Working $1 $199,999
Affluent $200,000 $999,999
HNW $1,000,000 $4,999,999
VHNW (very HNW) $5,000,000 $29,999,999
UHNW (ultra HNW) $30,000,000 $99,999,999
Elite $100,000,000 $999,999,999
Billionaire $1,000,000,000 And up

Aspire created its wealth tiers to make our research more efficient by understanding what’s typical. We estimate a prospect’s net worth and place him or her in the appropriate wealth tier. In its World Wealth Report, Capgemini defines high net worth (HNW) as US$1 million or more. We felt that further classification better represented differences in wealth and giving behavior at various levels of wealth.

At the Working, Affluent and HNW Tiers, real estate serves as the key asset. At VHNW, UHNW, Elite and Billionaire Tiers, the key asset shifts to business interests. Additionally, data from the 2016 Federal Reserve Survey of Consumer Finances describes Working and Affluent tiers, where a personal vehicle and residence represent most of the assets.

HNW Asset Allocation Model

Aspire adds asset allocation projections directly from Capgemini’s report, where it provides a breakdown of financial assets. Once we estimate net worth at the HNW or above wealth tiers, we apply the asset allocation model to reveal a prospect’s liquidity. Although imperfect, this asset allocation model meets the demands of fundraisers to have a better understanding of a prospect’s likely ability to make an immediate gift.

What Can I Do With the Result?

  • If you are an Aspire client, you can now understand at a glance how your prospect sits relative to her wealthy peers. You can use the wealth tiers and asset allocation model as guides. How does what you know about the prospect fit neatly into or deviate from what you know about a wealth tier or the typical asset allocation?
  • As you seek to differentiate the VHNW and above wealth tiers, recognize that you are looking to identify additional income and assets beyond earned income and real estate as well as different giving behaviors. You might identify multiple business interests, exclusive private banks (always check the bank name on the check), private foundations and other sophisticated giving vehicles, among other indicators.

Additional Resources

2017 Capgemini World Wealth Report

Curious about your HNW prospect’s liquid assets? We have good news!

By Erica Sauer

What Is The Report?

Compiled and written for the financial services sector, Capgemini’s World Wealth Report is now in its 21st year. It is based on survey responses from more than 2,000 HNWIs from across the globe and includes information about high net worth individual’s (HNWIs)
asset allocations, which is of key interest to fundraising research.

As defined by Capgemini, a HNWI is someone with investable assets of at least US$1 million excluding primary residence, collectibles, consumable, and consumer durables.

What Are Key Findings From The Report?

The number of HNWIs reached 4.8 million in the US in 2016 according to the Capgemini World Wealth Report. These HNWIs experienced exceptional returns of 24.3% on their portfolios on average in 2016.

GuideStar estimates the number of active nonprofits competing to capture the attention of these individuals at 1.8 million.

According to the Capgemini study, wealthy individuals keep more than half of their assets in liquid classes including cash, cash equivalents and equities. It reported, “HNWIs boosted their allocations toward equities and cash at the expense of alternative investments and real estate in 2016.”

Real estate holdings have remained a small portion of total assets over the years in North America (13.5% in 2013, down to 10.7% in 2017), but the transparency in the US has made the asset an anchor to prospect research. Conversely, equity, the largest asset class in North America for HNWIs (37.2% in 2013 to 37.1% in 2017), is only available for public company insiders.

What Can I Do As A Result?

  • There is tremendous wealth in the US and this wealth is set to grow with the Tax Cuts and Jobs Act recently passed by Congress. Click here for a webinar to learn how to identify this opportunity segment.
  • In the US, real estate is the anchor of a chain of data indicators that allows prospect research to identify HNW gift capacity. Wealth screenings typically identify this information for you. Your prospect research professional can use that information to estimate individual or household wealth.
  • HNWIs are holding a large portion of their wealth in liquid asset classes, which means a motivated donor can give your organization cash instead of other less liquid assets.

Additional Resources


2016 US Trust Study of High Net Worth Philanthropy

A High Net Worth Individual (HNWI) typically holds $1 million in liquid financial assets.

By Erica Sauer

The 2016 US Trust Study of High Net Worth Philanthropy examined charitable practices and preferences of wealthy households. The top perceived challenges for HNWI donors included “identifying what they cared about and deciding where to donate” (67.3%) and “understanding how much they can afford to give” (49.8%).

Top Takeaways

  1. Focusing on your prospect’s passions early in cultivation will help you identify good matches to your organization’s unique giving opportunities and develop the trust and engagement needed to make a major gift. For great ideas on how to ask the right questions to uncover your prospect’s passions, consider reading Power Questions: Build Relationships, Win New Business, and Influence Others by Andrew Sobel and Jerold Panas.
  2. Share your organization’s evidence of effectiveness, cost-effectiveness, transparency and room for more funding. GiveWell, a nonprofit that identifies giving opportunities, uses these criteria.
  3. A prospect may not know how much they can afford to donate. Present multiple funding options at your organization. Use prospect research to settle on an Ask Amount and consider the prospect’s capacity rating, philanthropic inclination and affinity.

 Sources